


Indicator Algorithm Course
Enrol for our trading course to learn and practice how to create…
Read More

Account Management
For account management, your trading account will be linked to our client-base…
Read More-
Previous Post
How to use the MT4
-
Next Post
Types of Forex Analysis
Related Posts
June 4, 2025
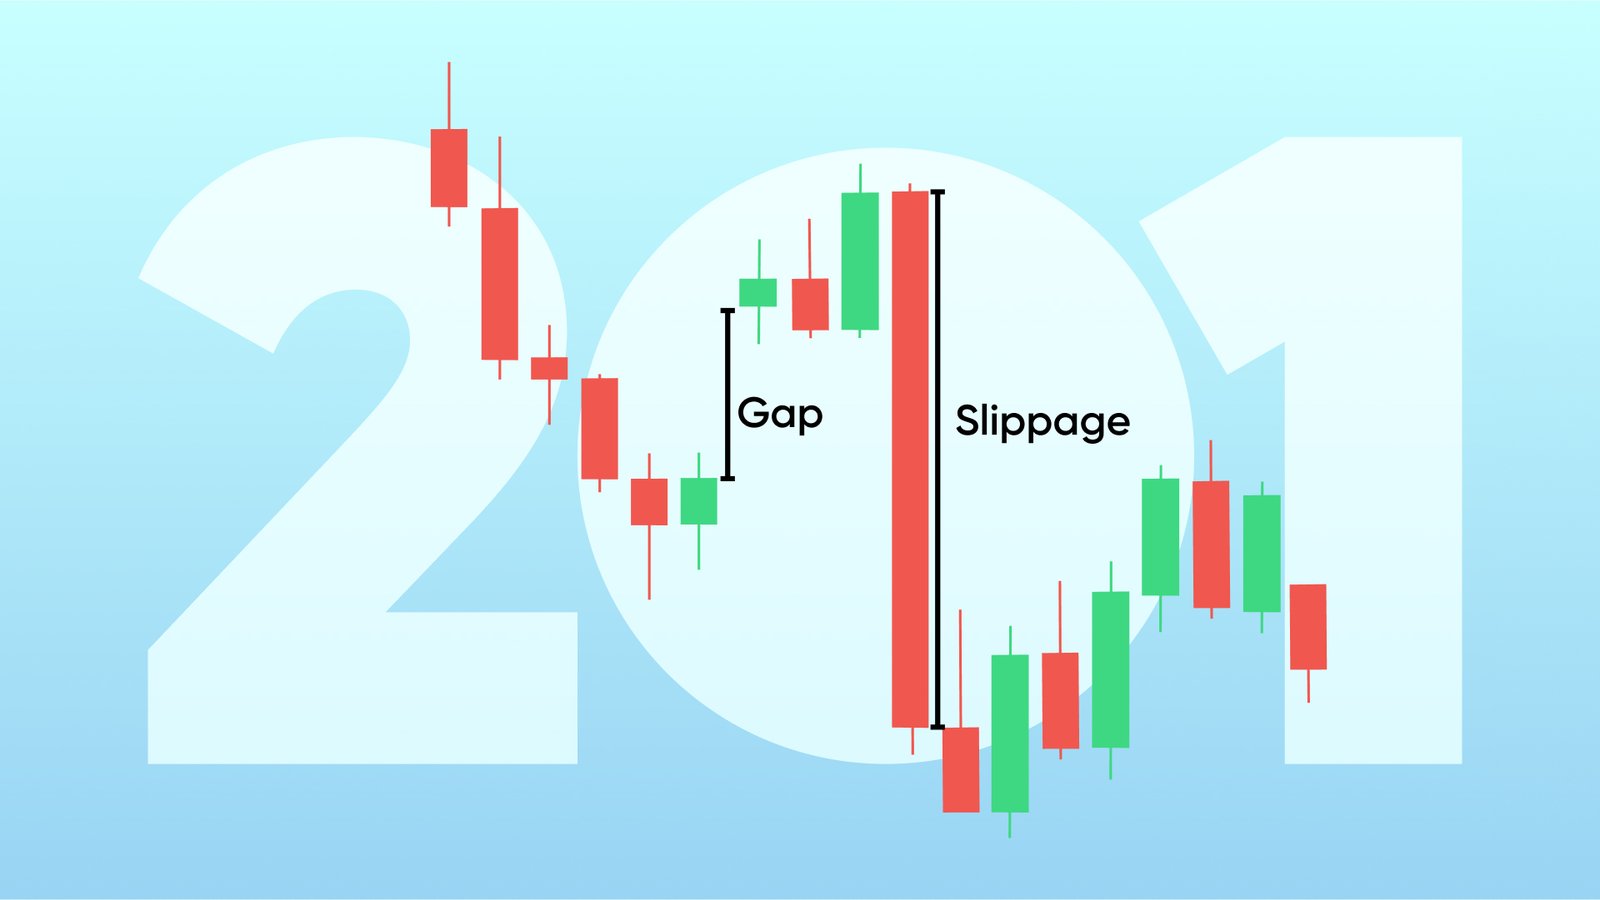
Market Slippage & Gaps
Market slippage and gaps are two of the biggest risks you’ll regularly encounter when trading.…